

Analytics in Proxima Cloud CRM covers an ever-growing number of Power BI reports, metrics, and data slices. This gives users more data to work with, but it also makes it harder to find a specific answer: they need to know which report contains the required metric, which filters to apply, and how to interpret the result.
Ask Copilot solves this problem. In Release 18.1, Power BI Reports gained the ability to move from the current report to Power BI Service and immediately work with it through Copilot. Instead of the flow “find the right page → review charts → manually compare metrics,” users can ask a business question in natural language and receive a ready analytical breakdown. This approach supports the Proxima Cloud CRM shift from traditional reporting to intelligent analytics and brings Copilot in Power BI into the day-to-day CRM analytics workflow.
Contents
Why AI in Power BI reports matters
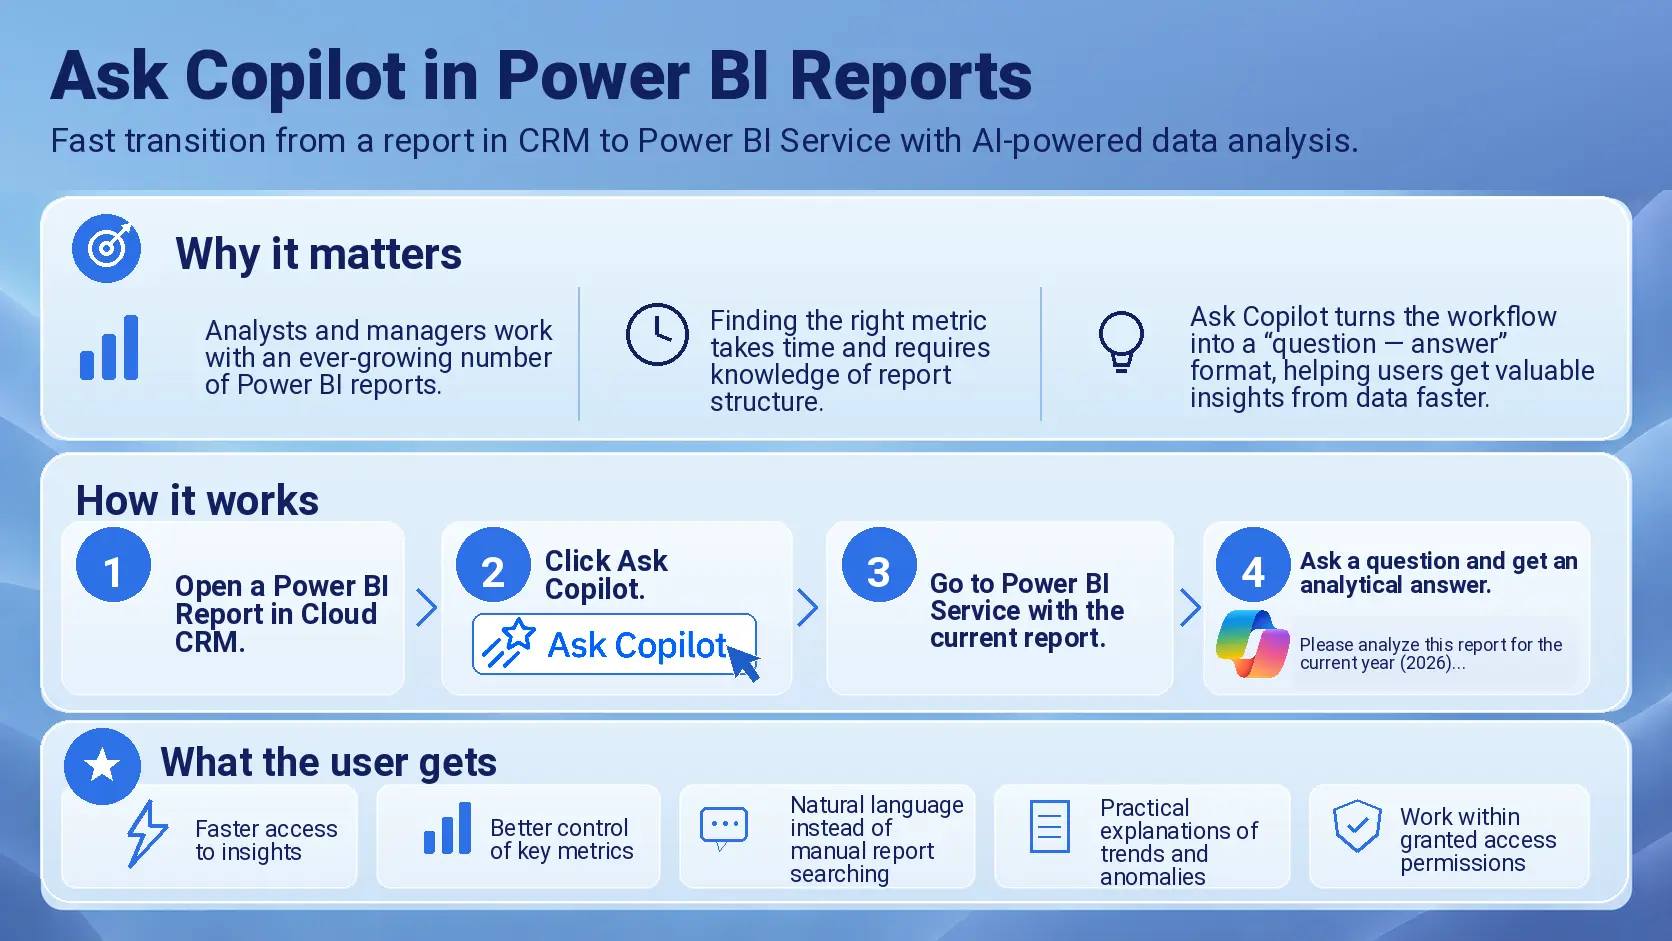
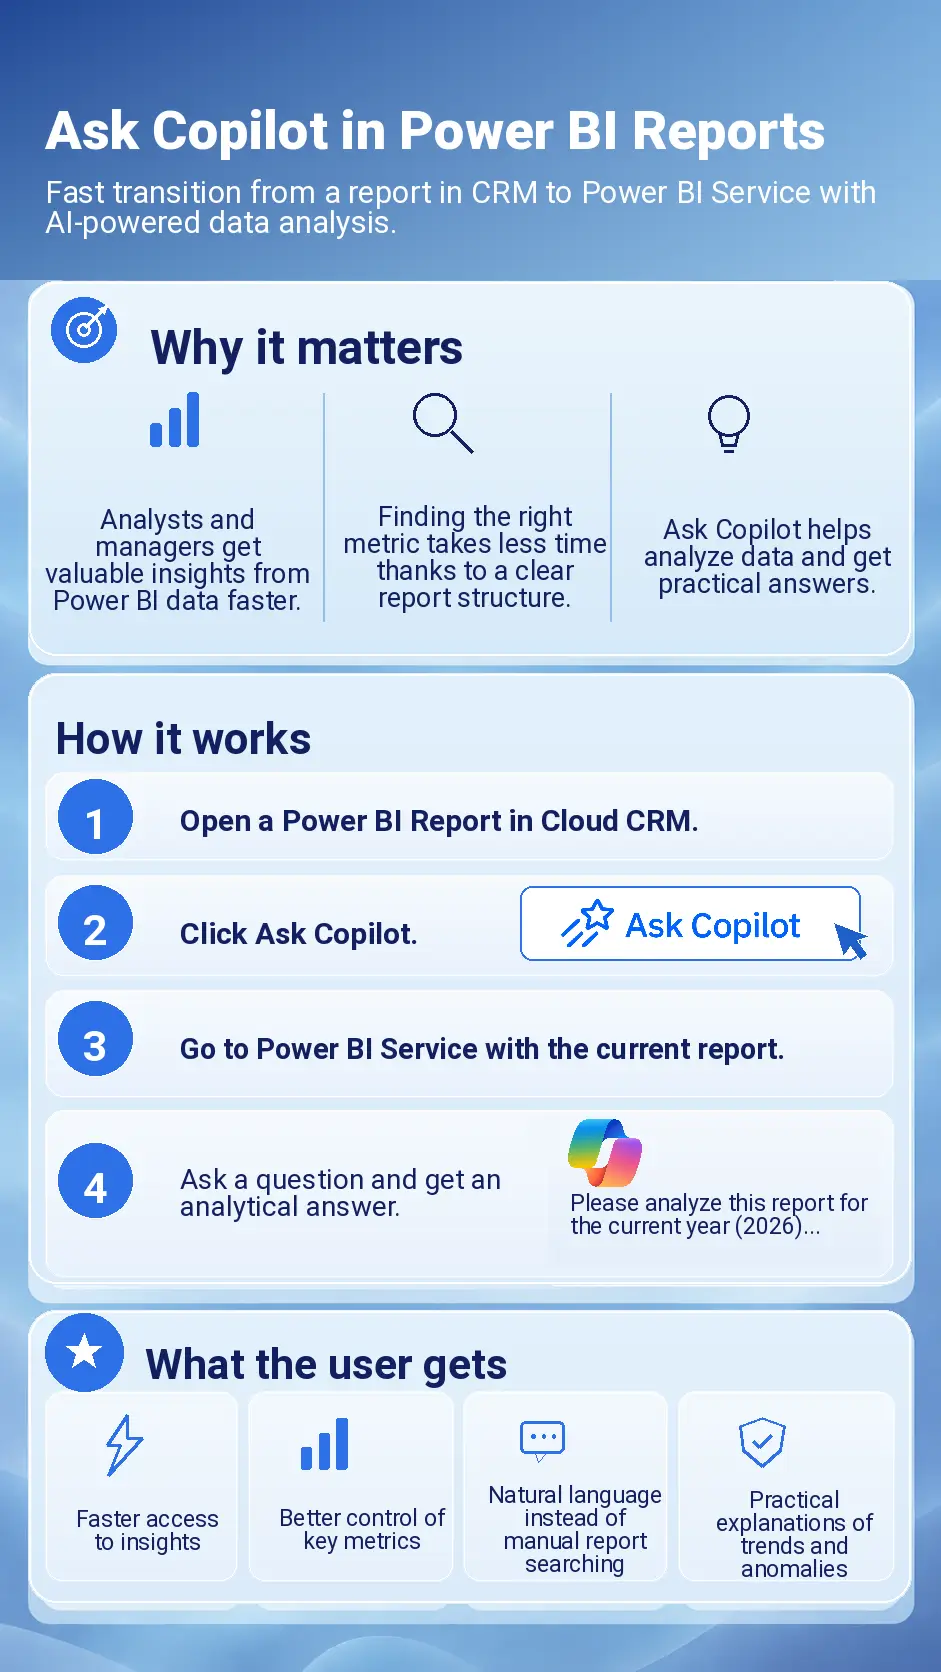
Ask Copilot lowers the barrier to analytics: users do not need deep knowledge of the Power BI model or to remember where every metric is located. This makes AI data analytics easier to use as the number of dashboards grows.
For a field representative — it can provide a quick answer about personal performance metrics.
For a regional manager — it can summarize results for a team or territory.
For a BI analyst — it can reduce ad hoc requests for manually prepared additional reports.
For a marketer — it provides faster access to the data needed for decision-making.
It is also important that Copilot works not as a separate general-purpose chat, but in the context of a Power BI report and its semantic model.
Artificial intelligence can do more than restate the numbers visible on screen: it can also use the model data available to it for deeper analysis. At the same time, the Power BI access model remains in place: users work only with data they are authorized to access.
How artificial intelligence works in Proxima Cloud CRM
Step 1. Open the required Power BI report in Cloud CRM.
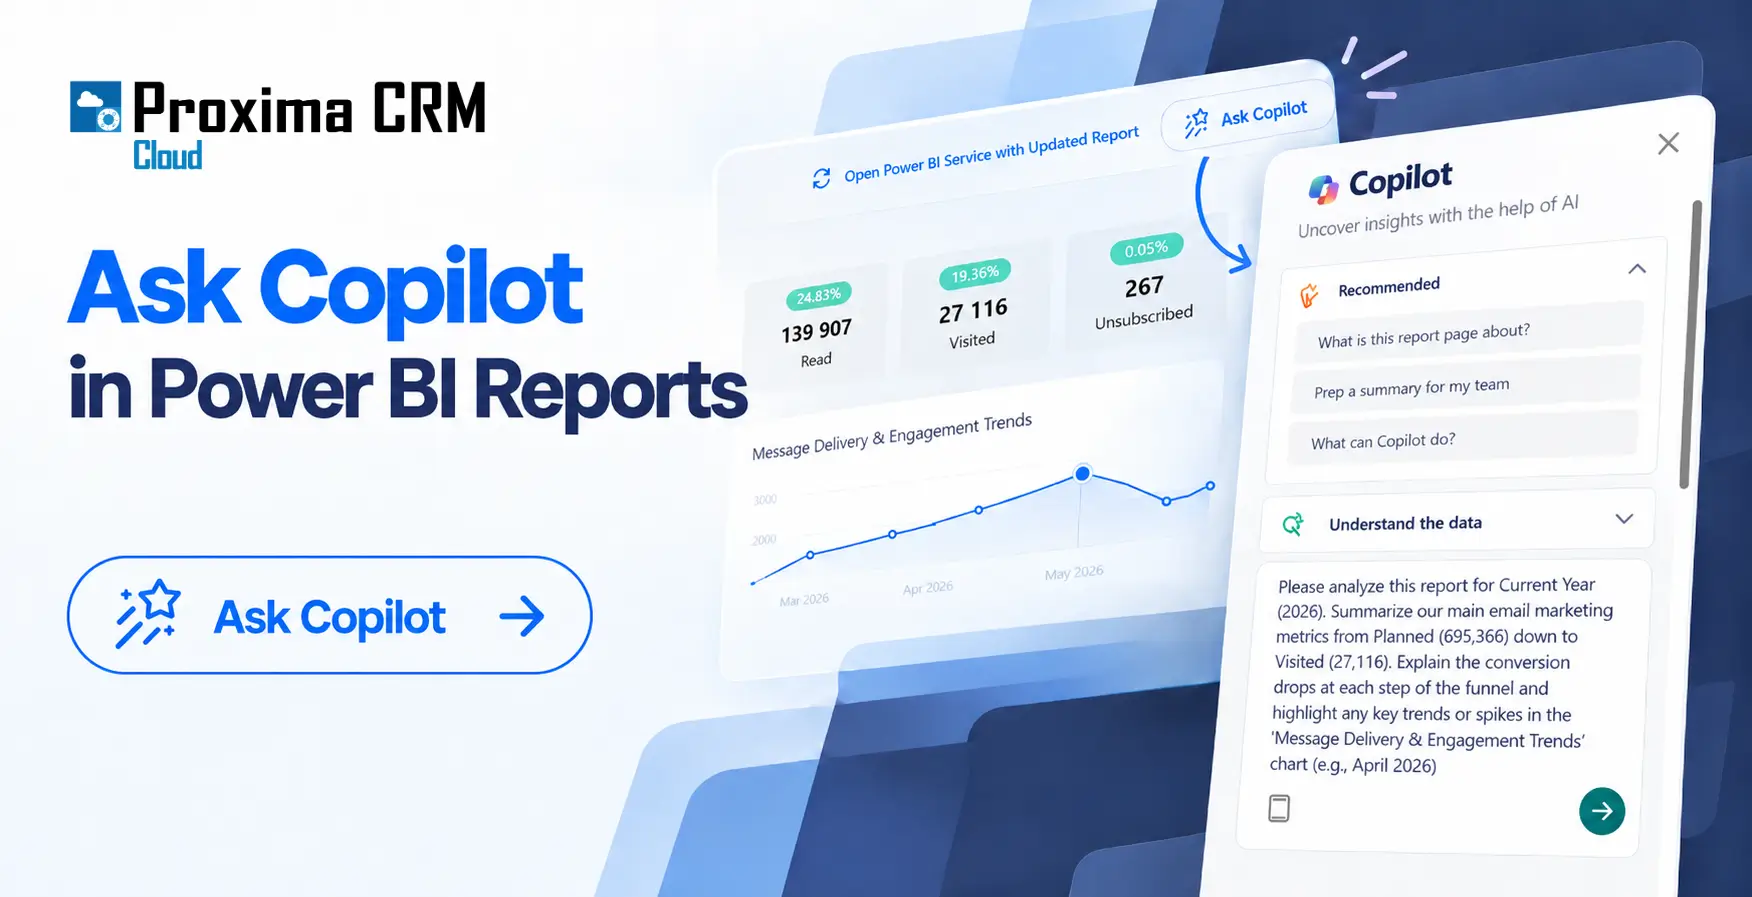
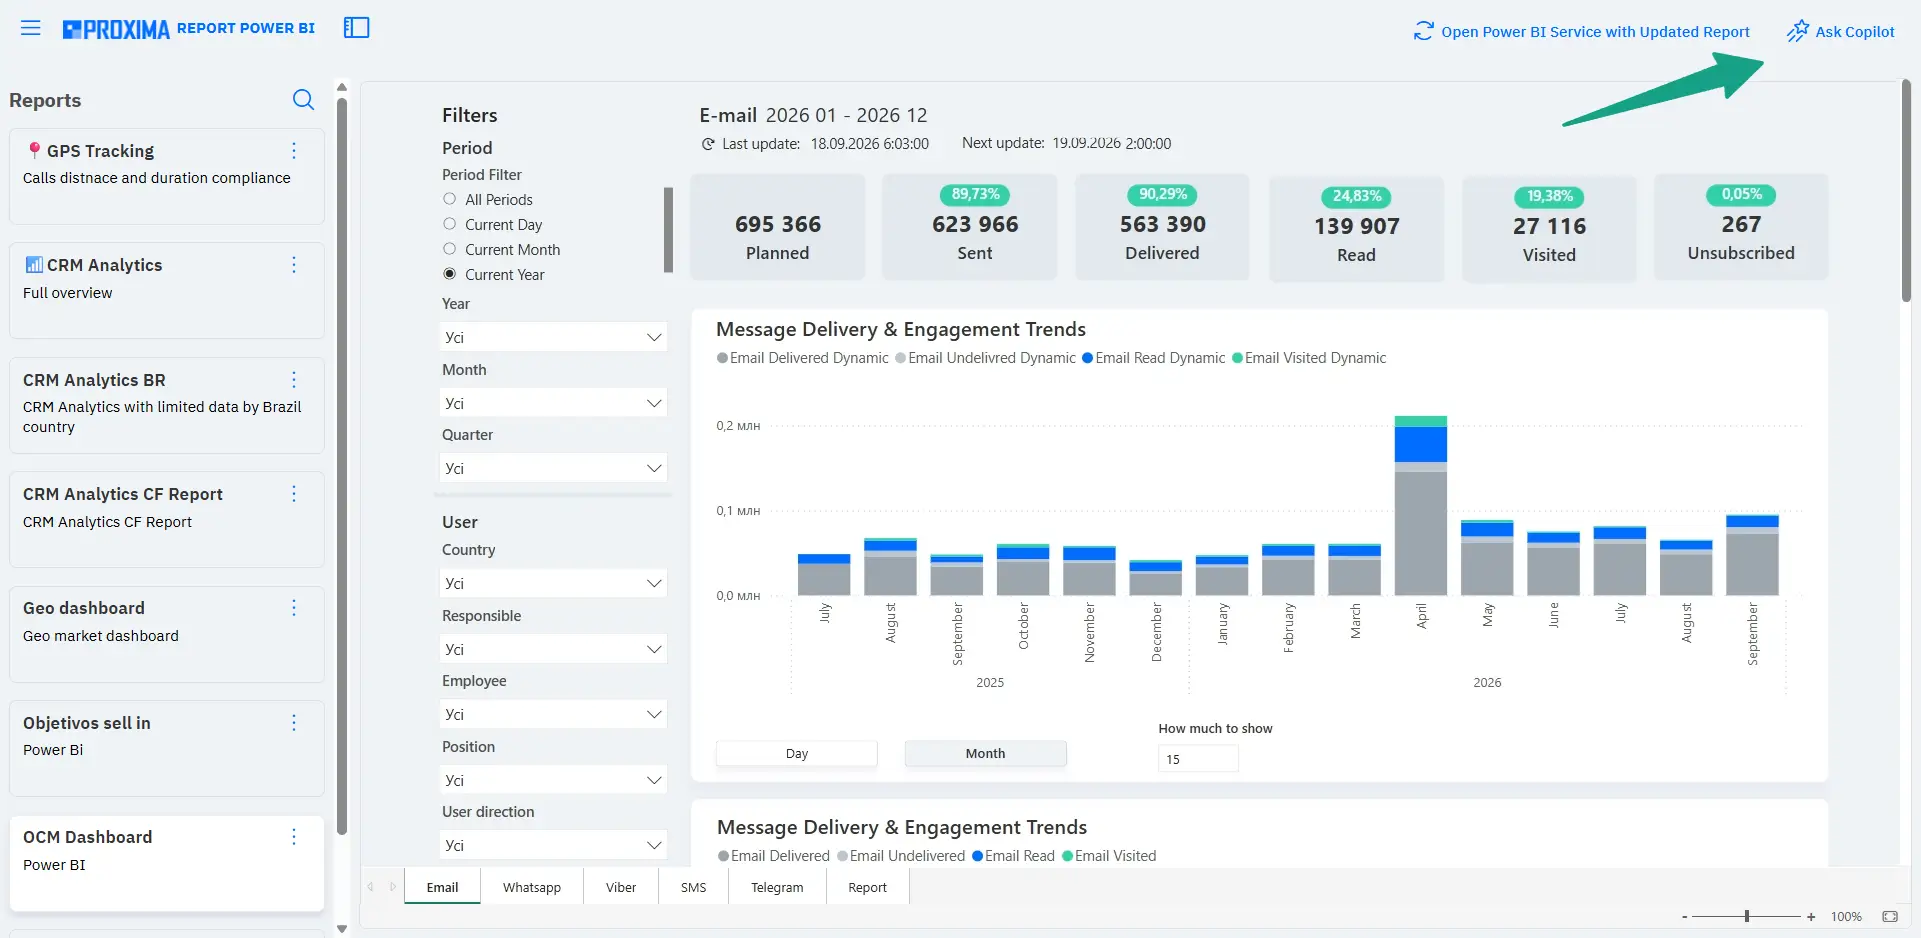
Using the OCM Dashboard as an example, the user sees a report with the main email metrics: Planned, Sent, Delivered, Read, Visited, and engagement trends.
Step 2. Click Ask Copilot.
A dedicated button is available at the top of the Power BI Report. When selected, Power BI Service opens with the current report, where the user can work with Copilot.
Step 3. Formulate a business question.
For the demo, we used a specific prompt rather than a generic “analyze the report” request. It sets the context, required KPIs, and the expected type of analysis.
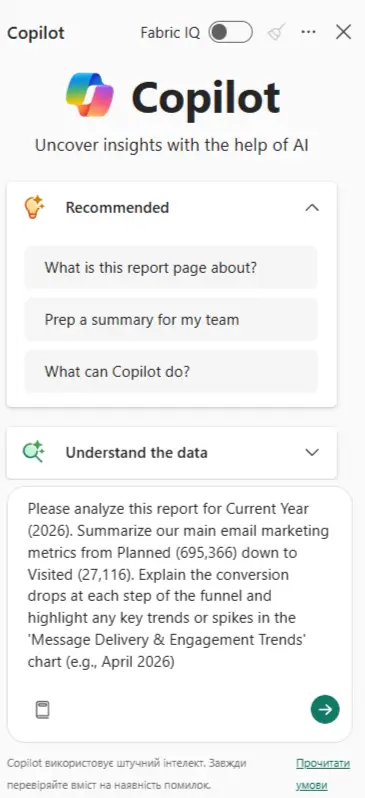
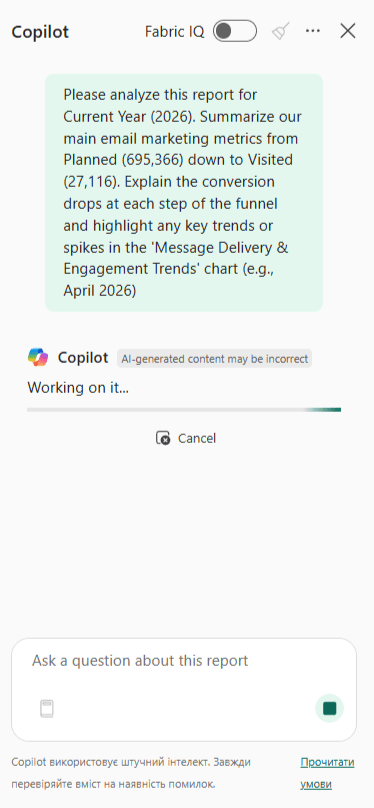
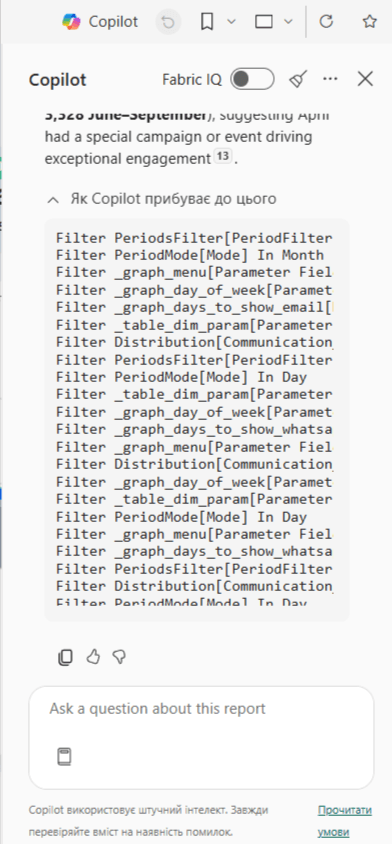
Screenshots 2–4. Copilot in Power BI Service: opening Copilot, entering a detailed prompt, and displaying the context and filters used to generate the response.
Example prompt:
“Please analyze this report for Current Year (2026). Summarize our main email marketing metrics from Planned (695,366) down to Visited (27,116). Explain the conversion drops at each step of the funnel and highlight any key trends or spikes in the 'Message Delivery & Engagement Trends' chart (e.g., April 2026).”
Step 4. Copilot generates an analytical response.
In our example, it reviewed the email funnel step by step, explained the losses between stages, and separately highlighted the April spike in the chart.
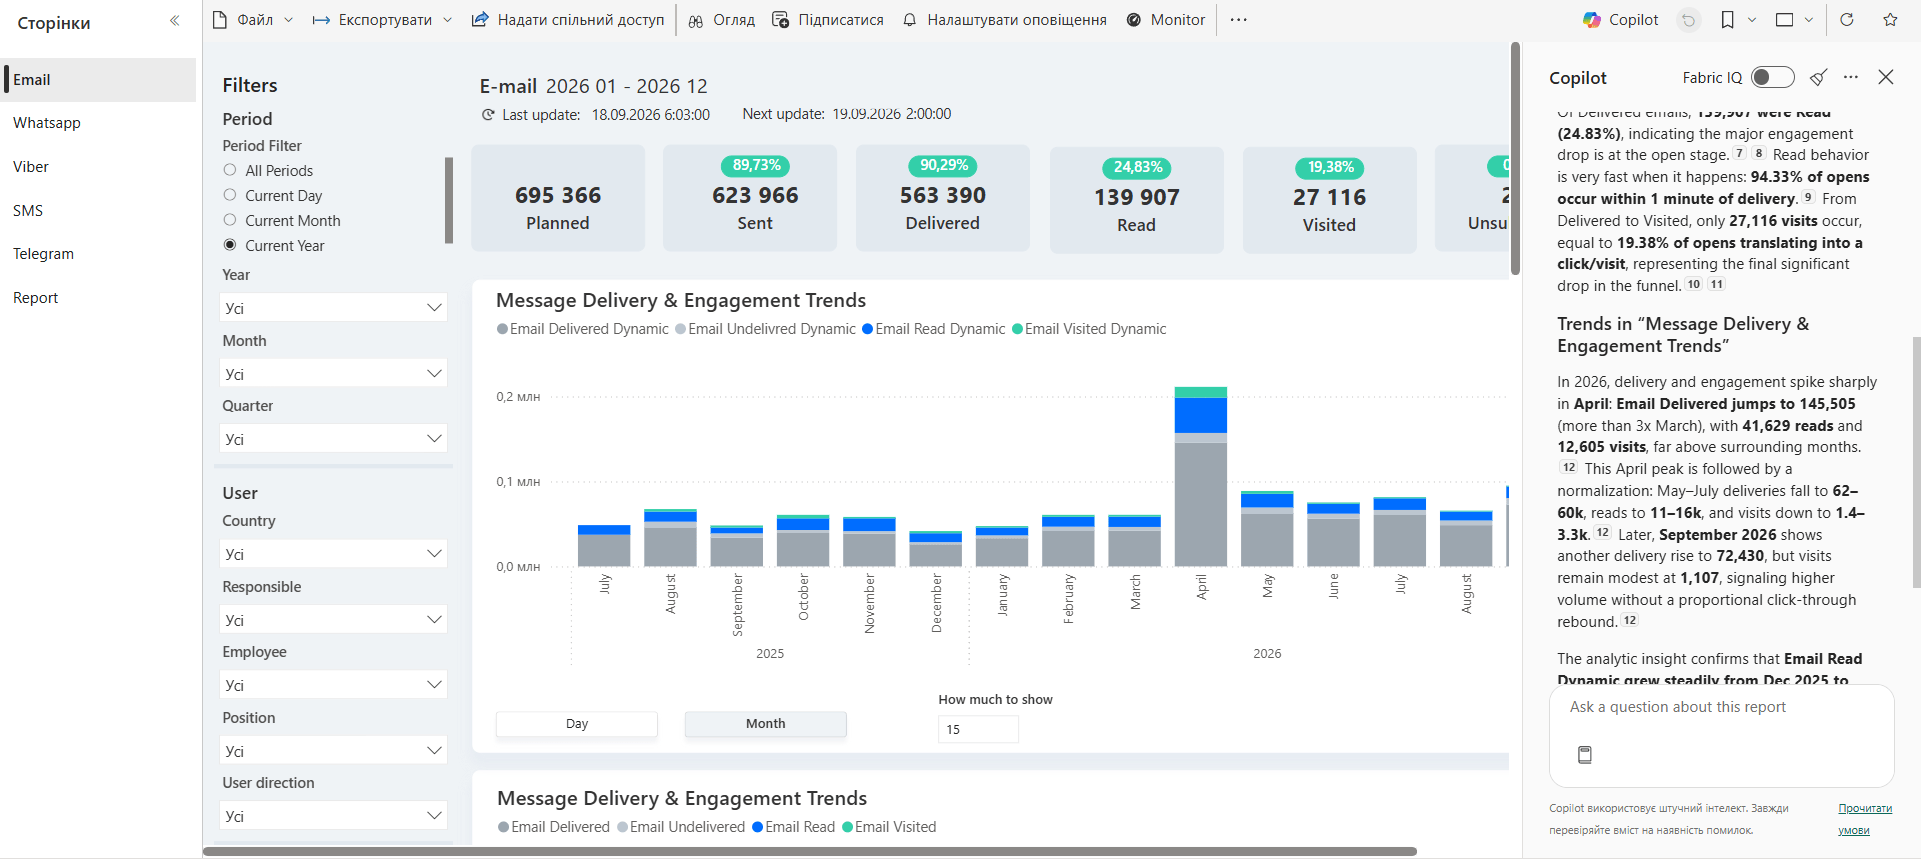
Based on the KPIs visible on the dashboard, the response correctly reproduced:
- Planned — 695,366;
- Sent — 623,966;
- Delivered — 563,390;
- Read — 139,907;
- Visited — 27,116;
- Delivery rate — 90.29%;
- Read rate — 24.83%;
- Visited / Read — 19.38%.
Copilot also correctly identified April 2026 as a clear anomalous spike in the Message Delivery & Engagement Trends chart.
What was especially revealing in the response
Part of the response repeats and calculates metrics that are directly visible on the dashboard. But Copilot also provided details that are not shown on the current screen — for example, reasons for non-delivery or how quickly recipients react after receiving an email.
Copilot response:
«From Planned 695,366 emails, 623,966 were Sent (89.73%), so about 11% of plans never became sends. The main reasons are missing active emails (67.34% of unsent) and prior unsubscribes (29.77%).From Sent, 563,390 were Delivered (90.29%), so ~10% dropped at the delivery step, mostly because mailboxes don’t exist (77.12% of undelivered) or servers/issues on the recipient side. Of Delivered emails, 139,907 were Read (24.83%), indicating the major engagement drop is at the open stage. Read behavior is very fast when it happens: 94.33% of opens occur within 1 minute of delivery. From Delivered to Visited, only 27,116 visits occur, equal to 19.38% of opens translating into a click/visit, representing the final significant drop in the funnel.
Trends in “Message Delivery & Engagement Trends” In 2026, delivery and engagement spike sharply in April: Email Delivered jumps to 145,505 (more than 3x March), with 41,629 reads and 12,605 visits, far above surrounding months. This April peak is followed by a normalization: May–July deliveries fall to 62–60k, reads to 11–16k, and visits down to 1.4–3.3k. Later, September 2026 shows another delivery rise to 72,430, but visits remain modest at 1,107, signaling higher volume without a proportional click-through rebound. The analytic insight confirms that Email Read Dynamic grew steadily from Dec 2025 to June 2026 but then declined starting July, and Email Visited Dynamic shows its steepest drop from July to September 2026 (1382→1107).» nd highlight any key trends or spikes in the 'Message Delivery & Engagement Trends' chart (e.g., April 2026).”
This means the analysis is not limited to visible cards and charts: Copilot can use the available context of the Power BI semantic model to explain the data in greater depth.
This is where the main practical value of the feature appears — the user receives not just a restatement of a visualization, but help interpreting the data.
AI access is controlled by the administrator
AI features are not activated for a client by force. Access to Copilot is controlled exclusively by the company’s artificial intelligence usage policy and is not enabled by default.
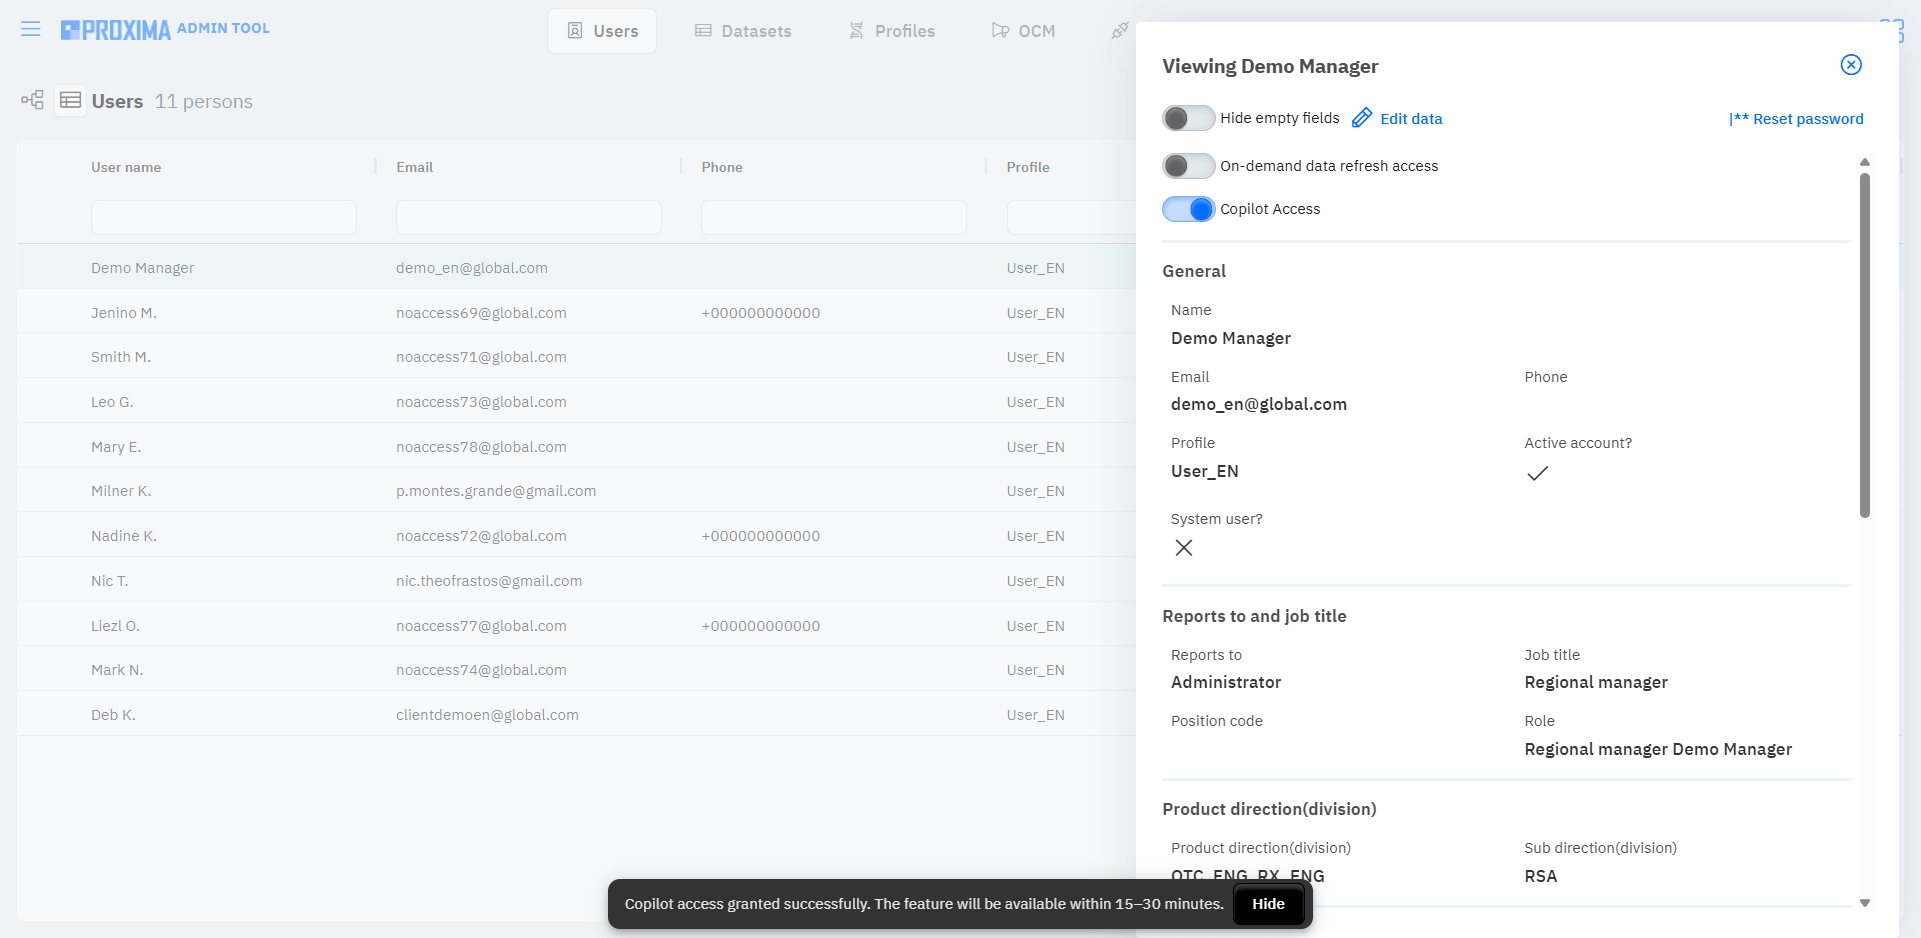

The administrator manages user access through Copilot Access in the profile. The system automates the required technical access settings, and the administrator can disable it at any time.
Try BI reports with Copilot in Proxima Cloud CRM
Request a demo from our team to review the settings and learn how Copilot is used in Proxima Cloud CRM.
Learn how Proxima Cloud CRM uses artificial intelligence in CRM to save time and simplify work for pharmaceutical company teams. Try it free.
*Note: This article uses screenshots from a demo environment containing anonymized or simulated data that does not pertain to real individuals.